Understanding TracerBench Results
The TracerBench `compare` command produces statistical reports in multiple variants:
- `stdout` stat summary report
- PDF/HTML box-plot report
- JSON stat summary report
All results below are coming from the following command with flags. The fixture data viewable on the TracerBench CLI GitHub Repo. Additionally the experiment is a build with an intentional regression via setTimeout of 1000 ms.
# tracerbench/6.0.0 darwin-x64 node-v14.16.0`tracerbench --version`# controlURL = file:///tracerbench/packages/cli/test/fixtures/release/index.html# experimentURL = file:///tracerbench/packages/cli/test/fixtures/regression/index.html...
tracerbench compare --controlURL --experimentURL --fidelity 10 --report
TracerBench Compare `stdout`
┌───────────────────────────────────────────────────────────────────────┐
│ Initial Render : duration │
├────────────────────────────────────────┬──────────────────────────────┤
│ │ Control: 10 │
│ Sample Counts: ├──────────────────────────────┤
│ │ Experiment: 10 │
├────────────────────────────────────────┴──────────────────────────────┤
│ │
├────────────────────────────────────────┬──────────────────────────────┤
│ │ MIN: 57ms │
│ ├──────────────────────────────┤
│ │ MAX: 163ms │
│ ├──────────────────────────────┤
│ │ 10th: 57ms │
│ ├──────────────────────────────┤
│ Control Seven Figure Summary: │ 25th: 59ms │
│ ├──────────────────────────────┤
│ │ 50th: 64ms │
│ ├──────────────────────────────┤
│ │ 75th: 66ms │
│ ├──────────────────────────────┤
│ │ 90th: 83ms │
├────────────────────────────────────────┴──────────────────────────────┤
│ │
├────────────────────────────────────────┬──────────────────────────────┤
│ │ MIN: 1131ms │
│ ├──────────────────────────────┤
│ │ MAX: 1185ms │
│ ├──────────────────────────────┤
│ │ 10th: 1133ms │
│ ├──────────────────────────────┤
│ Experiment Seven Figure Summary: │ 25th: 1134ms │
│ ├──────────────────────────────┤
│ │ 50th: 1140ms │
│ ├──────────────────────────────┤
│ │ 75th: 1156ms │
│ ├──────────────────────────────┤
│ │ 90th: 1184ms │
├────────────────────────────────────────┴──────────────────────────────┤
│ │
├────────────────────────────────────────┬──────────────────────────────┤
│ Hodges–Lehmann estimated delta: │ 1077ms │
├────────────────────────────────────────┴──────────────────────────────┤
│ │
├────────────────────────────────────────┬──────────────────────────────┤
│ 95% confident the delta is between: │ 1068ms to 1097ms │
├────────────────────────────────────────┬──────────────────────────────┤
│ P-Value: │ 0.6949 │
├────────────────────────────────────────┴──────────────────────────────┤
│ │
├────────────────────────────────────────┬──────────────────────────────┤
│ Is Significant: │ true │
├────────────────────────────────────────┴──────────────────────────────┤
│ │
├────────────────────────────────────────┬──────────────────────────────┤
│ Control Sparkline │ █▁▁▁▁▁▁▁▁▁▁▁ │
├────────────────────────────────────────┼──────────────────────────────┤
│ Experiment Sparkline │ ▁▁▁▁▁▁▁▁▁▁▁█ │
└────────────────────────────────────────┴──────────────────────────────┘
┌───────────────────────────────────────────────────────────────────────┐
│ Sub Phase of Duration : domComplete │
├────────────────────────────────────────┬──────────────────────────────┤
│ │ Control: 10 │
│ Sample Counts: ├──────────────────────────────┤
│ │ Experiment:: 10 │
├────────────────────────────────────────┴──────────────────────────────┤
│ │
├────────────────────────────────────────┬──────────────────────────────┤
│ │ MIN: 57ms │
│ ├──────────────────────────────┤
│ │ MAX: 163ms │
│ ├──────────────────────────────┤
│ │ 10th: 57ms │
│ ├──────────────────────────────┤
│ Control Seven Figure Summary: │ 25th: 59ms │
│ ├──────────────────────────────┤
│ │ 50th: 64ms │
│ ├──────────────────────────────┤
│ │ 75th: 66ms │
│ ├──────────────────────────────┤
│ │ 90th: 83ms │
├────────────────────────────────────────┴──────────────────────────────┤
│ │
├────────────────────────────────────────┬──────────────────────────────┤
│ │ MIN: 1131ms │
│ ├──────────────────────────────┤
│ │ MAX: 1185ms │
│ ├──────────────────────────────┤
│ │ 10th: 1133ms │
│ ├──────────────────────────────┤
│ Experiment Seven Figure Summary: │ 25th: 1134ms │
│ ├──────────────────────────────┤
│ │ 50th: 1140ms │
│ ├──────────────────────────────┤
│ │ 75th: 1156ms │
│ ├──────────────────────────────┤
│ │ 90th: 1184ms │
├────────────────────────────────────────┴──────────────────────────────┤
│ │
├────────────────────────────────────────┬──────────────────────────────┤
│ Hodges–Lehmann estimated delta: │ 1077ms │
├────────────────────────────────────────┴──────────────────────────────┤
│ │
├────────────────────────────────────────┬──────────────────────────────┤
│ 95% confident the delta is between: │ 1068ms to 1097ms │
├────────────────────────────────────────┴──────────────────────────────┤
│ │
├────────────────────────────────────────┬──────────────────────────────┤
│ Is Significant: │ true │
├────────────────────────────────────────┴──────────────────────────────┤
│ P-Value: │ 0.8181 │
├────────────────────────────────────────┴──────────────────────────────┤
│ │
├────────────────────────────────────────┬──────────────────────────────┤
│ Control Sparkline │ █▁▁▁▁▁▁▁▁▁▁▁ │
├────────────────────────────────────────┼──────────────────────────────┤
│ Experiment Sparkline │ ▁▁▁▁▁▁▁▁▁▁▁█ │
└────────────────────────────────────────┴──────────────────────────────┘
!! ALERT Regression found exceeding the set regression threshold of 100 ms
Benchmark Results Summary
duration phase estimated difference +1077ms [1068ms to 1097ms]
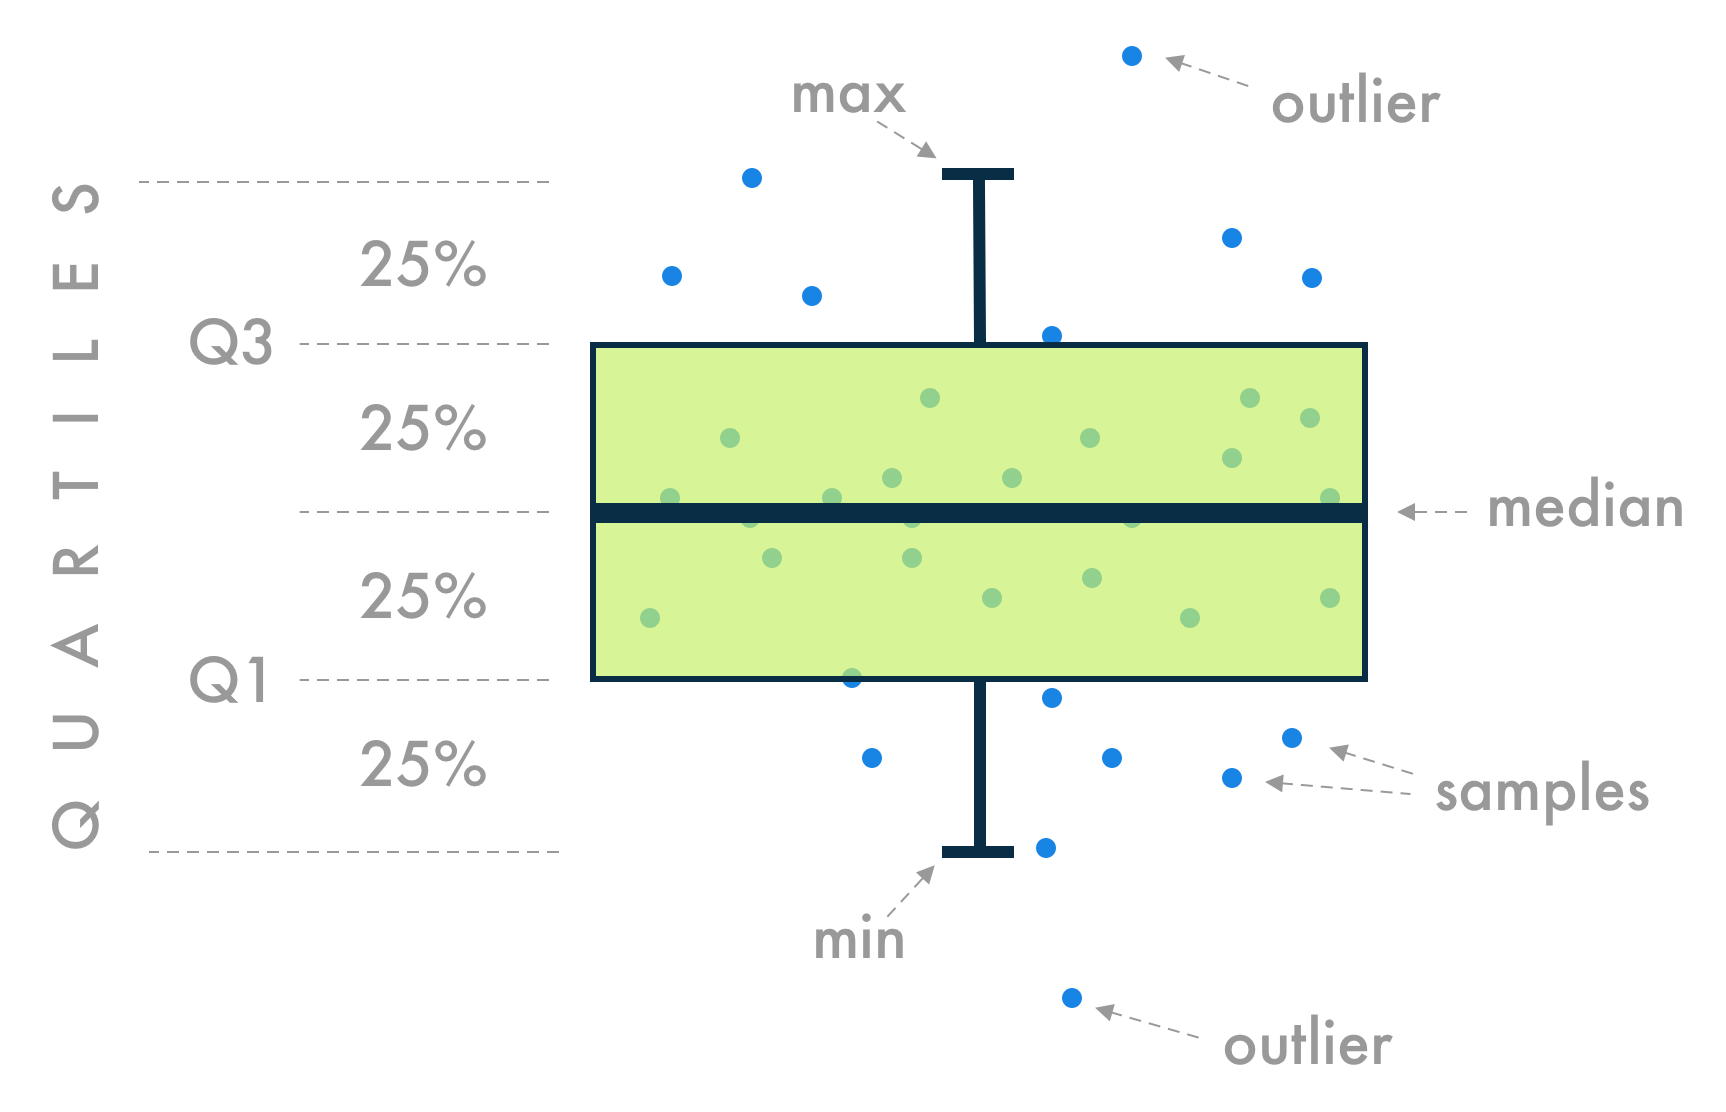
domComplete phase estimated difference +1077ms [1068ms to 1097ms]TracerBench Compare PDF/HTML Box-Plots
Understanding The Box-Plot Results
TracerBench Compare JSON
import Compare from "tracerbench";

const results = await Compare.run([
  "--controlURL",
  "--experimentURL",
  "--fidelity=10",
  "--headless",
  "--report",
]);
const resultsJSON = JSON.parse(results);
...
# log resultsJSON{
  benchmarkTableData: [
    {
      heading: 'Initial Render',
      phaseName: 'duration',
      isSignificant: true,
      pValue: 0.8392,
      estimatorDelta: '1077ms',
      controlSampleCount: 10,
      experimentSampleCount: 10,
      confidenceInterval: [Array],
      controlSevenFigureSummary: [Object],
      experimentSevenFigureSummary: [Object],
      asPercent: [Object]
    }
  ],
  phaseTableData: [
    {
      heading: 'Sub Phase of Duration',
      phaseName: 'domComplete',
      isSignificant: true,
      pValue: 0.8392,
      estimatorDelta: '1077ms',
      controlSampleCount: 10,
      experimentSampleCount: 10,
      confidenceInterval: [Array],
      controlSevenFigureSummary: [Object],
      experimentSevenFigureSummary: [Object],
      asPercent: [Object]
    }
  ],
  areResultsSignificant: true,
  isBelowRegressionThreshold: false,
  regressionThresholdStat: 'estimator'
}